Charts can be added to reports to further show data and show trends in your data. The report builder lets you add a Pie Chart, Bar Chart, or Line Graph to your report.
Follow the steps below to add each chart type to a report.
Select Reports > Builder.
Use the Show All button to view all custom reports. Or use the Search Bar to further drill down your search.
Select the Report from the list.
Click on Charts from the side panel.
Click the Add Chart button.
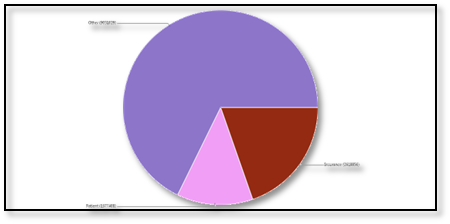
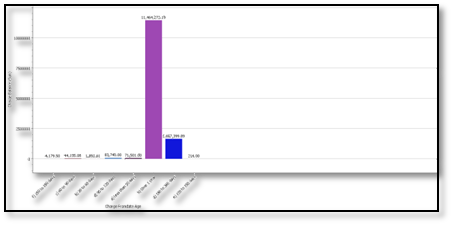
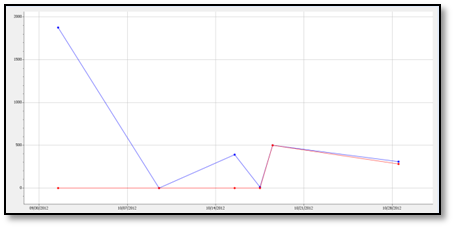
Select the Chart Type: Pie Chart, Bar Chart, or Line Graph
Enter the Chart Title.
Optional: If Bar Charts are selected, use the Bar Orientation drop-down menu to specify how the chart should be displayed.
Drag a report field to the [Chart Type] Label section. The field chosen will be represented as separate sectors for each possible value. The available field list for the sector label will be limited to Text field types within the data sets included on the report.
Drag a report field to the [Chart Type] Data section. The field chosen will be represented as the quantity of each label on the chart. The available field list for the data sector will be limited to Money, Number and ID field types within the data sets included on the report.
Use the Aggregation drop-down menu to select how the chart should aggregate the data.
Click Done, then click Save.