Information shown on a report is specified by the fields and formatting options chosen for the columns.
Fields can be added to a report as columns by selecting the desired field from the Report Fields list and dragging it into the Columns pane. The fields within the Columns list will be prioritized from top to bottom and will display from left to right when viewing the report. Simply click and drag to reorder the columns.
Fields can be removed from a report within the Report Builder by hovering over the field and clicking the X icon.
 For a complete list of available fields and their descriptions reference the Report Field Description Guide.
Follow the steps below to add a column(s) to the report.
Select Reports > Builder.
Use the Show All button to view all custom reports. Or use the Search field to further drill down your search.
Select the Reports from the list.
In the Report Fields pane
Expand the Report Field category folder you wish to begin building the report off of
Or use the Search for Fields to search for fields in all categories.
 You can search and filter by a specific field type (Date, ID, Money, Number, Text) by Clicking
 and limiting the search to specific report field types.
Drag and drop the field into the Columns pane.
 You can search and filter by a specific field type (Date, ID, Money, Number, Text) by Clicking
 To rename a column, simply right click on the report field after moving the field from the Reports Field pane and select Change Name.
Formatting options are available for Date and Money fields. Follow the steps below to change how the value is displayed on the report.
Select Reports > Builder.
Use the Show All button to view all custom reports. Or use the Search field to further drill down your search.
Select the Report from the list.
Right click on the field after it has been dragged onto the Columns pane and select the desired option from the Format menu list.
Date Field Formats: Display date and time serial numbers according to the type that you specify. Date fields that display time stamp information (hours, minutes, and seconds) along with the date information only display the first four formatting options for the date. The timestamp portion of the field will always show as "HH:MI:SS".
Money Field Formats: Display monetary values and the default currency symbol with numbers. You can specify the number of decimal places that you want to use, whether you want to use a thousand separator, and how you want to display negative numbers.
Protected Health Information (PHI) Field Formats: Social Security Numbers, by default, are masked preventing the first six digits from being viewed. All CollaborateMD standard reports protect Patient Health Information (PHI), however, you can choose to unmask the Social Security Number (SSN) if needed.
Right-click on the field after it has been dragged onto the Columns pane and unselect the "Mask SSN" from the menu list to unmask the first six (6) digits from the SSN.
Important: In order to remain HIPAA compliant we strongly recommend keeping the SSN masked. Only users with the Patient Health Information permission can obtain the full value by accessing the patient's account.
Setting an Aggregation on a field will group like rows together based on other columns. Aggregation options are available for Date, Money, Number, and ID fields. By default, no aggregation is selected for any field types. If an Aggregation option is selected for a field, you will find the type of aggregation in parenthesis next to the field.
Follow the steps below to change the aggregation for each field:
Select Reports > Builder.
Use the Show All button to view all custom reports. Or use the Search field to further drill down your search.
Select the Report from the list.
Right-click on the field after it has been dragged onto the Columns area and select the desired option from the Aggregation menu.
Date Field Aggregation:
No Aggregation: Displays all of the dates the patient has.
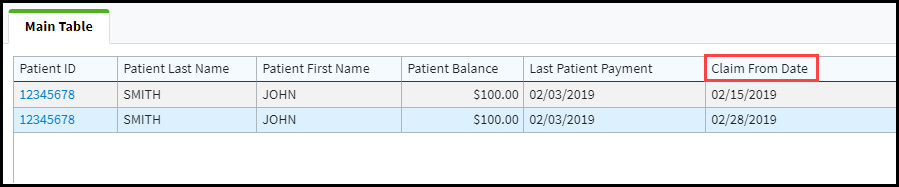
Maximum: Displays the most recent date.
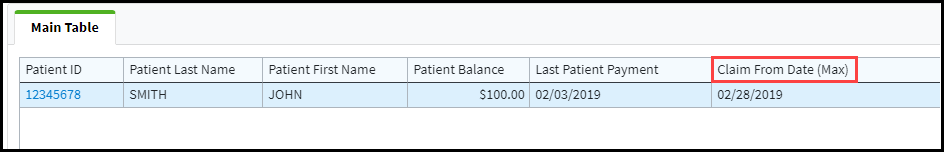 If aggregation is set to Maximum for the Claim From Date field, the report will only display the most recent Claim From Date.
Minimum: Displays the earliest date.
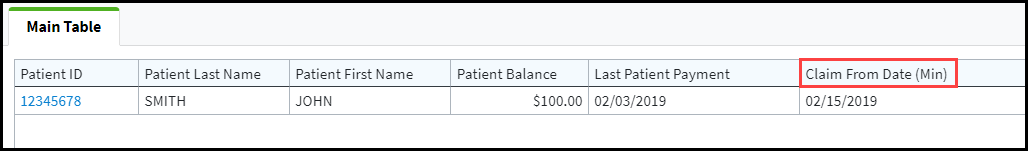 If aggregation is set to Minimum for the Claim From Date, the report will only display the earliest Claim From Date.
Money Field Aggregation
No Aggregation: Displays all of the amounts.
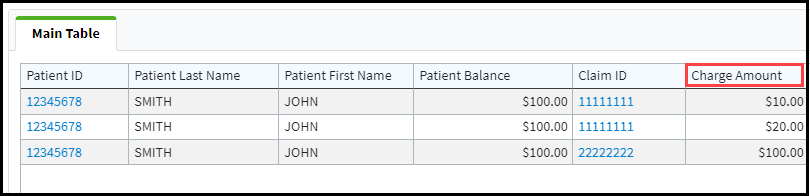
Sum: Displays the summation (total) of the values.
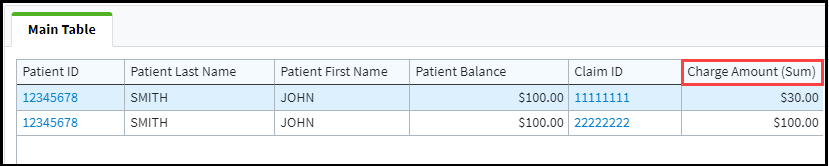 If aggregation is set to Sum for the Charge Amount field, the report will display the Average for the only Charge Amount column.
Average: Displays the average of the values.
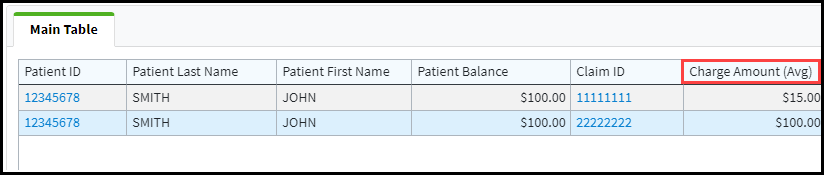 If aggregation is set to Average for the Charge Amount field, the report will only display the Average for the only Charge Amount column.
Maximum: Displays the largest value.
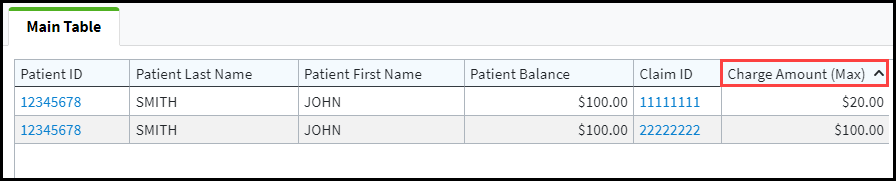 If aggregation is set to Maximum for the Charge Amount field, the report will display the largest charge amount for each claim.
Minimum: Displays the smallest value.
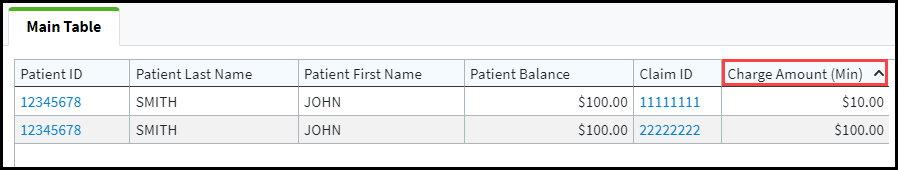 If aggregation is set to Minimum for the Charge Amount field, the report will display the smallest charge amount for each claim.
Check Your Understanding:
Notice the two like rows have been grouped together based on the non-aggregated fields and the Charge Amount is now reporting the average value for the grouped like rows. The last row on the report was not grouped with the first two rows because the Claim ID value was different (i.e. this charge was associated with a separate claim).
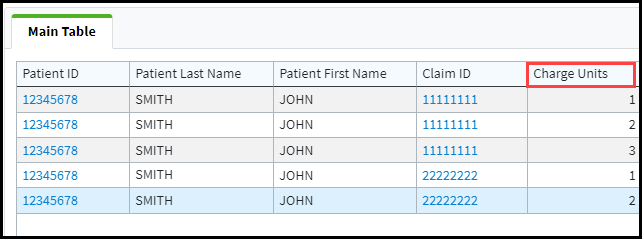
Number Field Aggregation
No Aggregation: Displays all of the values.
Sum: Displays the summation (total) of the values.
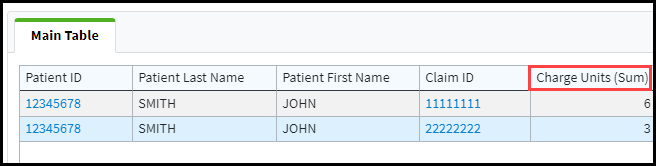 If aggregation is set to Sum for the Charge Units field the report will only display the sum value for the Charge Units.
Average: Displays the average of the values.
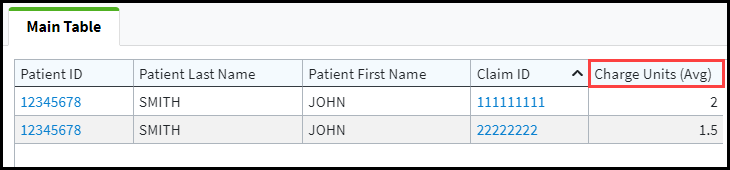 If aggregation is set to Average for the Charge Units field, the report will display the average charge units for each Claim ID.
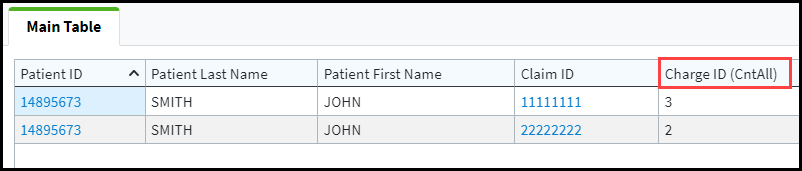
Count All: Displays the count of all occurrences of the value.
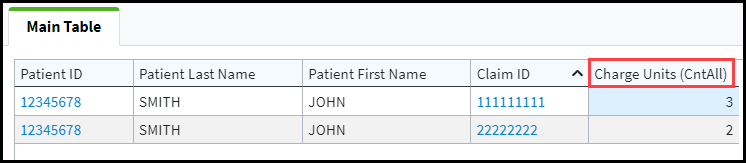 If aggregation is set to Count All for the Charge Units field, the report will display each occurrence for within a claim.
Count Unique: Displays the count of all unique occurrences of the value.
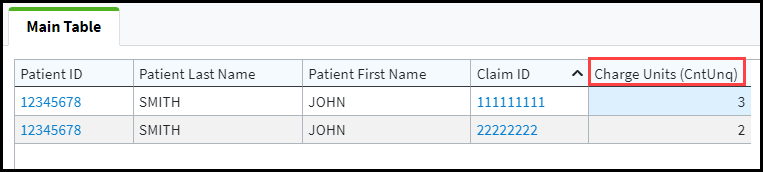 If aggregation is set to Count Unique for the Charge Units field, the report will display each unique occurrence for within a claim.
Maximum: Displays the largest value.
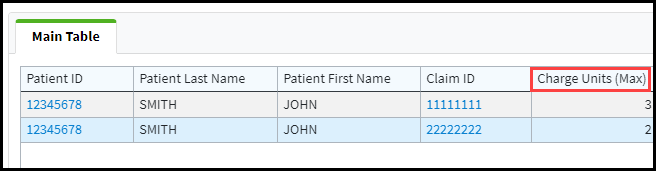 If aggregation is set to Maximum for the Charge Units field, the report will only display the largest value for the Charge Units.
Minimum: Displays the smallest value.
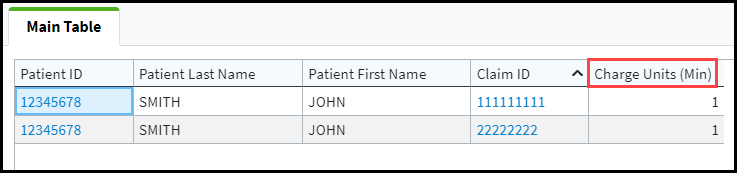 If aggregation is set to Minimum for the Charge Units field, the report will only display the smallest value for the Charge Units.
Check Your Understanding:
Notice that the two like rows have been grouped together based on the non-aggregated fields and the Charge Units is now reporting the summed value for the grouped like rows. The last row on the report was not grouped with the first two rows because the claim ID value was different (i.e. this charge was associated with a separate claim). The Charge Units field now represents the total number of units billed on the claim regardless of the number of line items.
ID Field Aggregation
No Aggregation: Displays each occurrence of the value.
Count All: Displays the count of all occurrences of the value.
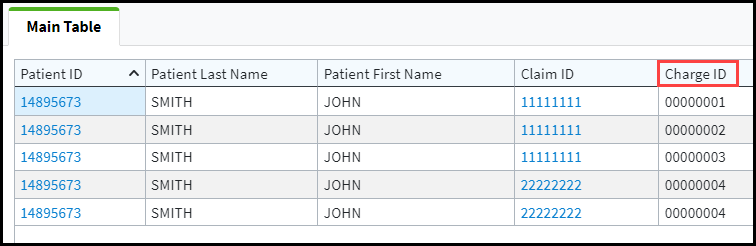
 If aggregation is set to Count All for the Charge From Date field, the report will display each Charge ID within each claim.
Count Unique: Displays the count of all unique occurrences of the value.
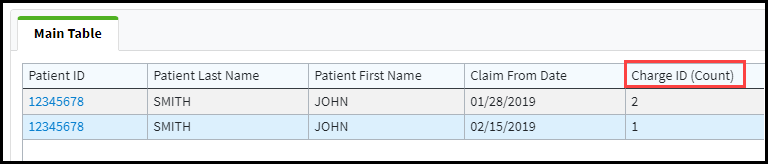 If aggregation is set to Count Unique for the Charge From Date field, the report will only display the total count of the Charge ID(s).
Check Your Understanding:
Notice that the two like rows have been grouped together based on the non-aggregated fields and the Charge ID is now reporting a count of the unique values in the Claim ID field for the grouped like rows. The last row was not grouped with the first two rows because the Claim From Date value was different. This is because the charge was associated with a separate claim. The Charge ID field now represents the total count of unique charges (or line items) for each claim.


A Calculated Column takes information from two existing fields and performs a calculation between the two fields to present new data.
Two types of calculated columns may be created based on the fields that are added to the Columns pane: Number-based and Date-based calculated columns.
- Available calculations for numeric-based calculated columns are: Addition (+), Subtraction (-), Multiplication (x), Division (/)
- Available calculations for date-based calculated columns are: Days between, Months between, Age
The first step to creating a calculated column is to verify that the fields you want to be calculated are added to the Columns pane. The columns must exist in order for the calculation to occur.
-
Select Reports > Builder.
-
Use the Show All button to view all custom reports. Or use the Search field to further drill down your search.
-
Select the Report from the list.
-
Add the desired columns to the report.
-
Click the Calculated link found on the top right corner of the columns pane.
-
Enter the Title for the calculated column.
-
Select your Calculation Type (Number or Date).
-
Use the Columns 1 Type drop-down menu to select if the first column to be used in the calculation will be a Column, or a Fixed Value.
Fixed Value should be used for certain reporting use cases that require calculations based on a fixed number rather than another column. For instance, for some services, the number of units is a fraction of the time spent (e.g., each unit represents 15 minutes). For Number Calculation Type: Enter your fixed value 1 (this field accepts a minimum value of -99,999,999, a maximum value of 99,999,999, and up to 10 decimal places).
-
Use the Calculation drop-down menu to select the calculation (Plus, Minus, Multiplied By, Divided, By).
-
Use the Columns 2 drop-down menu to select the second column to be used in the calculation.
-
Click Done
 If you ever want to edit a calculated column, all you have to do is right-click on the column name within the Report builder and select the "Edit Calculation" option.
The Display Totals at the bottom of the report option is available for Money, Number, ID, and Text fields.
By default, the Display Totals option is not selected for any all field type(s). If the Display Totals option is selected for a field, the field will be underlined.
For Money and Number fields will insert a line at the bottom of the report and show the summation for that specific value of all rows on the report.
For ID and Text fields will insert a line at the bottom of the report and show the count of all values or all unique values within that column for all rows on the report.
Follow the steps below to change the Display Totals option for fields.
Select Reports > Builder.
Use the Show All button to view all custom reports. Or use the Search field to further drill down your search.
Select the Report from the list.
Right-click on the field after it has been dragged onto the Columns pane and select Display Totals from the menu list.
If one or more fields on the report is grouped and the Display Totals option is enabled for a specific field, the subtotals for the field within each group will be displayed on the report along with the Grand Total for the report.
You can easily configure a column to be hidden by default when a report is run. A hidden column won’t display on the report, but can still be shown if desired via the Report Viewer’s right-click capabilities.,
Follow the steps below to hide a particular column by default.
Select Reports > Builder.
Use the Show All button to view all custom reports. Or use the Search field to further drill down your search.
Select the Report from the list.
Right-click on the field after it has been dragged onto the Columns pane and select Hide column from the menu list.
Check Your Understanding:
Under what situations would someone want to hide a column on their report instead of simply removing it? There may be many different scenarios in which hiding a column(s) on the report would be more beneficial than removing it, but the 2 most common reasons are:
- You use a column in some situations when running the report but not all the time. If this is the case, hiding the column prevents you from having to create 2 separate reports.
- You are using the column as part of a Calculated Column, but all you care about is the resulting calculation. In this case, the column is necessary for other columns (and needed on the report), but in itself may not be useful to you.